Why does observability matter in cloud-native GCP environments?
In cloud-native environments like GCP, where services scale dynamically and failures are often unpredictable, observability provides the critical ability to detect, diagnose, and resolve incidents proactively.
Observability turns noise into insight and insight into action.
In this article, we’ll address core concepts, real-world challenges in Google Cloud Platform (GCP), the building blocks of response automation, a practical walkthrough scenario, key takeaways, and recommendations.
Practical benefits of observability
Observability in cloud-native systems offers more than just visibility. It provides operational advantages that drive reliability, speed, and efficiency across your workflows.
While this article focuses on GCP examples, the concepts apply universally to any modern distributed environment (whether running on AWS, Azure, hybrid infrastructure, or Kubernetes clusters).
Observability benefits
- Faster troubleshooting
With integrated logs, metrics, and traces, engineers no longer need to jump between disconnected tools. GCP observability centralizes signals, allowing teams to spot anomalies and trace their root cause in seconds rather than hours. - Reduced MTTR (Mean Time to Resolve)
Automated alerting combined with rich contextual data means teams can deal with incidents faster. When monitoring detects an issue, workflows and functions kick in to attempt immediate remediation, which reduces the burden on human responders. - Improved performance
Observability enables continuous optimization. Teams can detect latency spikes, resource exhaustion, and dependency bottlenecks before they escalate, leading to smoother application performance and better customer experiences. - Less context-switching across tools
Instead of stitching together logs from one tool, metrics from another, and traces from a third, GCP's native observability tools create a unified workflow. This eliminates tool fatigue and speeds up both proactive monitoring and reactive debugging.
Observability vs. monitoring in cloud-native systems
Let’s begin with a fundamental distinction: monitoring vs. observability. Monitoring is about answering predefined questions. Is the service running? Has the CPU threshold been exceeded? It's about assessing the known conditions of your systems. Observability, however, gives you the ability to ask new questions when something goes wrong. It’s about understanding the why, even when the what is unfamiliar.
Monitoring provides answers to predefined questions using metrics and thresholds. Observability enables dynamic, in-depth exploration using logs, traces, and contextual signals. In other words, monitoring asks if things are OK; observability helps uncover why they’re not.
This distinction is critical in cloud-native environments, where complexity and dynamism require more than just static metrics. Because cloud-native systems are distributed and constantly evolving, observability helps teams identify root causes and reduce downtime, even in unfamiliar failure modes.
A helpful metaphor here is to think of monitoring like vital signs—checking a patient’s temperature, heart rate, or oxygen levels. These show that something is wrong, but not why. Observability is the diagnostic layer that examines the symptoms. In people, high temperature, headache, and a runny nose might indicate the flu. In systems, correlating logs, metrics, and traces helps us uncover the root cause of an issue.
The three pillars of GCP observability
From a data perspective, observability is built upon three types of signals often referred to as the three pillars: metrics, logs, and traces.
In GCP, these pillars are supported by Google Cloud’s dedicated tools: Cloud Monitoring uses metrics and alerts as the basis for monitoring strategy. Cloud Logging provides centralized access to logs from all your services. And Cloud Trace allows detailed analysis of request-level performance.
While Cloud Monitoring is foundational for visibility, integrating all three—metrics, logs, and traces—makes robust observability possible.
Logs: How to use Cloud Logging effectively
Logs record discrete events in text form, offering a sequential view of system activity. The term logs actually comes from sailors measuring their speed. They would toss a log overboard, attached to a rope with knots at regular intervals. Counting how many knots passed through their hands in a set time, they would calculate their nautical speed in knots and record this in the logbook. This practice of keeping a running chronological record became the foundation for the modern use of logs in computing. Computing logs are records of events that happen within a system, preserving a history of operational activities.
When a service crashes, logs expose the exact exception, stack trace, and service context. This can look like Cloud Logging capturing “Out of memory” just before a GKE pod termination. Logs are also critical in debugging authentication failures, showing the precise timestamp, IAM principal, and service account involved.
Metrics: How to leverage Cloud Monitoring for metric collection and analysis
Metrics provide quantifiable measurements like CPU usage or request latency. These are numerical values tracked over time, which represent the system’s state or behavior.
Metrics from Cloud Monitoring can show latency spikes. For example, a 95th percentile latency breach indicates degraded user experience before alerts fire. CPU and memory metrics can reveal capacity bottlenecks; for instance, sustained high CPU usage on a Cloud Run service might signal the need for horizontal scaling.
Traces: How to implement Cloud Trace for understanding application flow
Traces show the journey of individual requests as they travel through distributed systems, which helps pinpoint blockages or failure points. Just like physical traces leave behind evidence, a software system trace represents the footprint of a request. As it traverses various services, functions, or infrastructure components, it records the sequence, duration, and context of each step along the way. This concept mirrors following a route on a map, allowing engineers to follow the exact flow of execution to locate inefficiencies or failures.
Cloud Trace helps identify where time is being lost, such as a backend service introducing 400 ms latency due to DB retries. Traces are particularly useful in microservice architectures to detect which internal call chain is slowing down the system. For example, a request traversing five services might show that 80% of the total time is being spent in a payment validation step.
Measuring incident responses
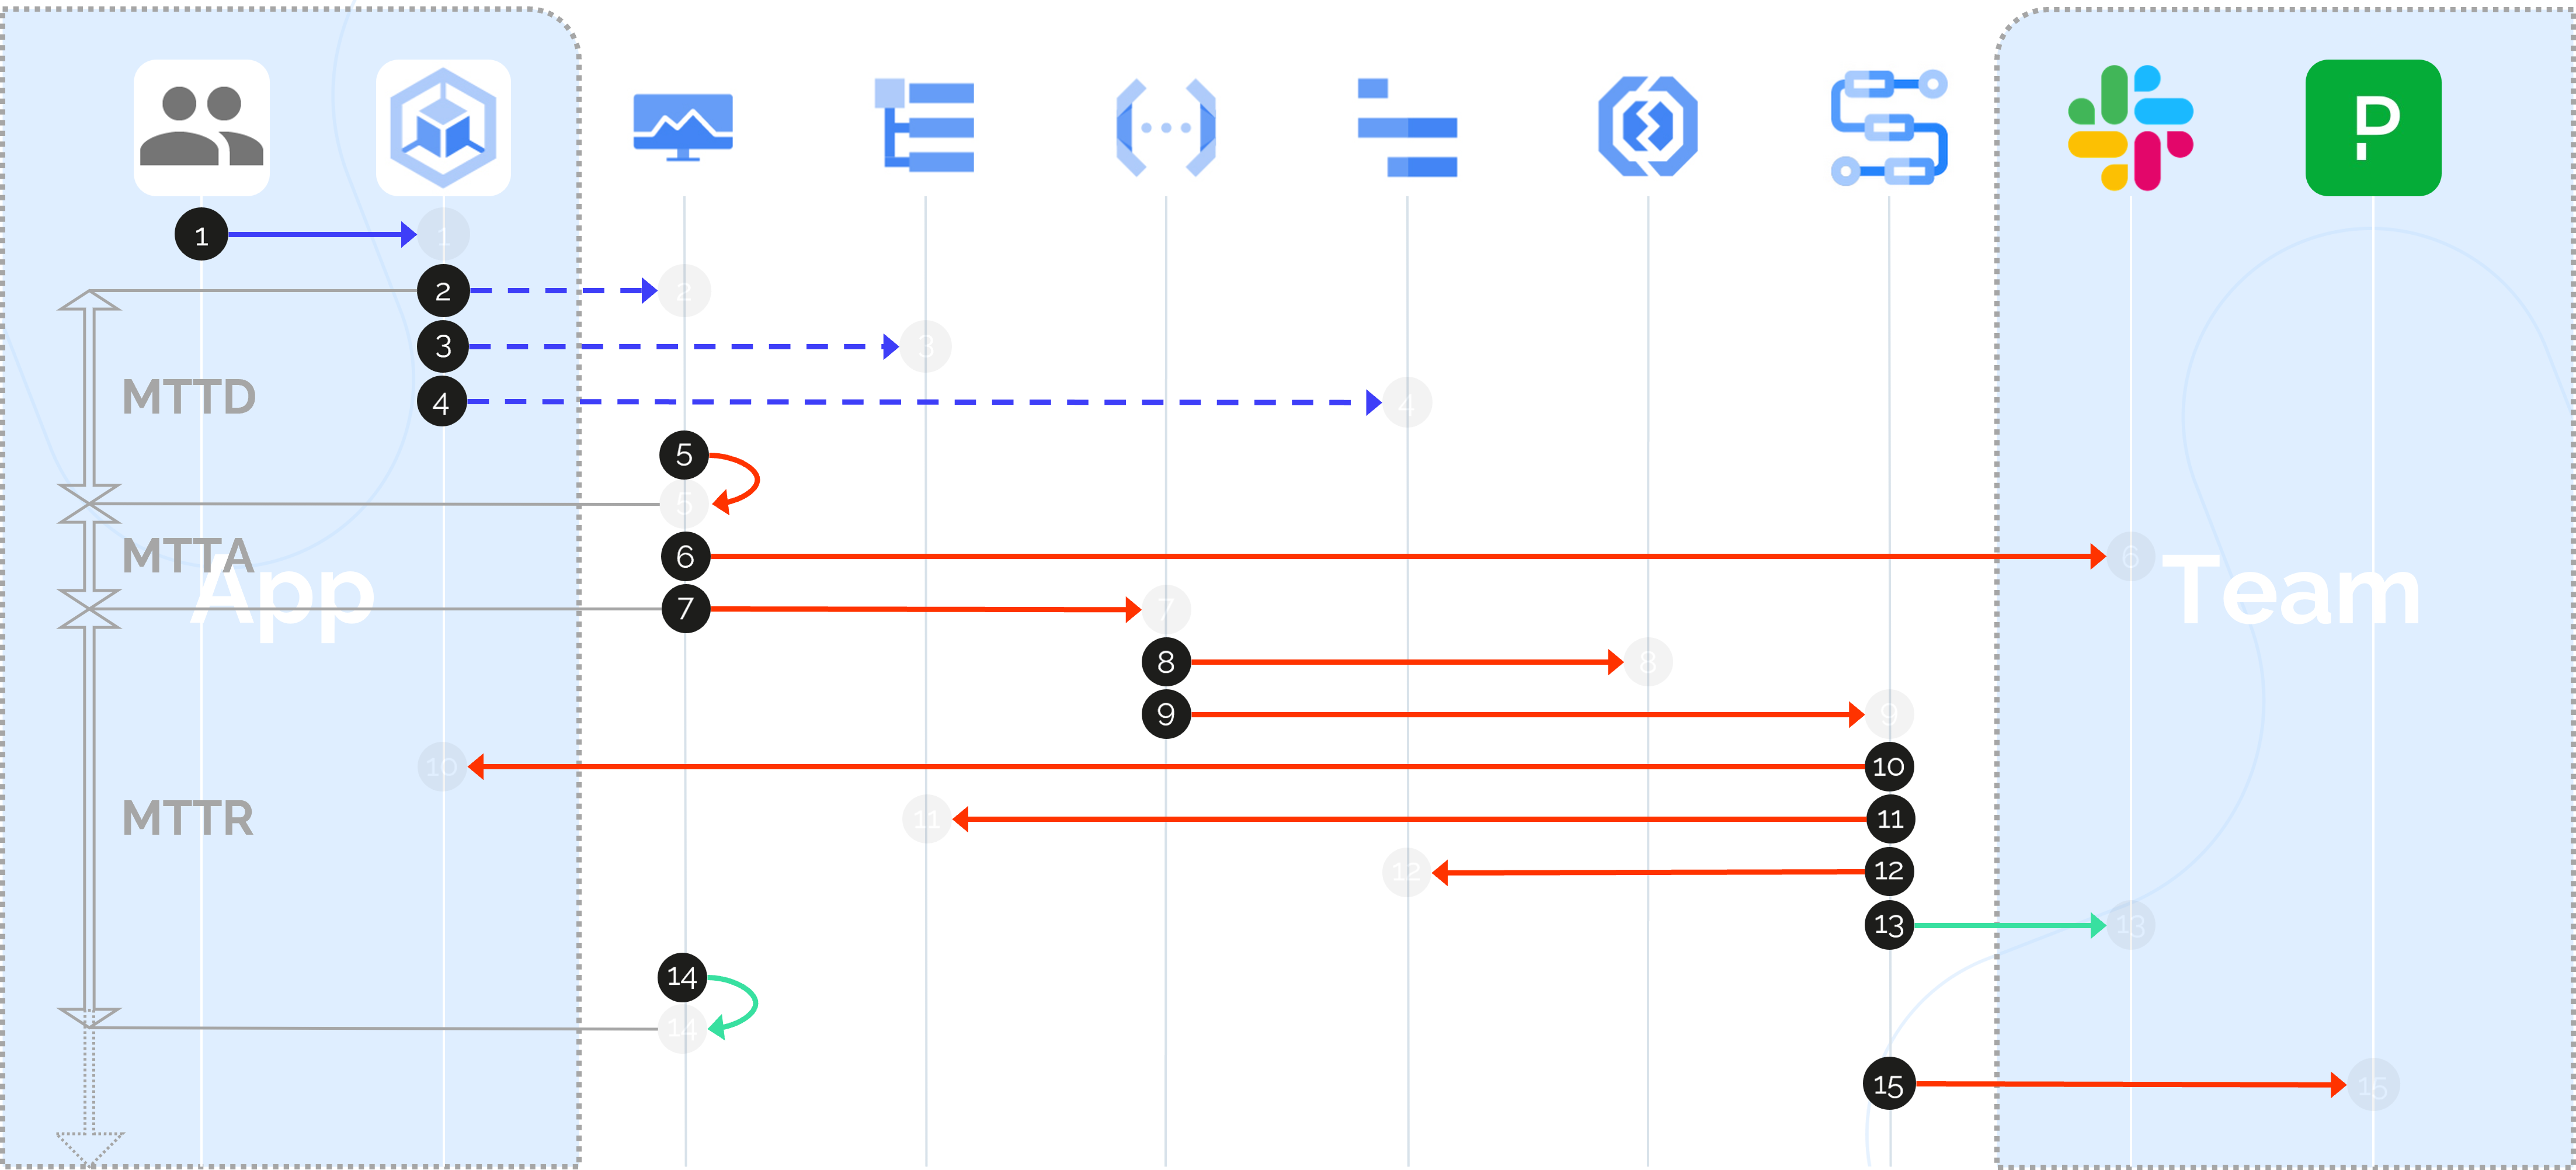
How do we measure the effectiveness of our response? Three key metrics help us understand and optimize our incident management process: MTTD, MTTA, and MTTR.
MTTD (Mean Time to Detect) measures how quickly your systems can detect an issue. It reflects the responsiveness of your monitoring setup—how finely tuned your metrics, thresholds, and alert conditions are to detect anomalies, outages, or degradations. A low MTTD signals that your system’s telemetry and signal processing are effective at surfacing problems before they escalate.
MTTA (Mean Time to Acknowledge) represents the time it takes for a human to recognize and begin acting on an alert after it has been triggered. This metric is deeply influenced by the signal-to-noise ratio of your alerts. If your system produces frequent false positives, MTTA tends to increase due to alert fatigue. Therefore, MTTA directly measures human responsiveness while indirectly assessing the quality of your monitoring and alerting configurations.
MTTR (Mean Time to Resolve) really shows observability’s indispensability. MTTR covers the entire process from detection and acknowledgment to fully resolving the incident. It hinges on how effectively engineers can navigate logs, traces, metrics, and error reports to uncover root causes and implement fixes. Observability’s role here is critical because poor system visibility inflates MTTR, while strong observability accelerates diagnostics and recovery.
These metrics are meaningful because they create a feedback loop: MTTD and MTTA reflect how fast you detect and mobilize, while MTTR reflects how deeply you understand and resolve the problem. Collectively, they highlight where to invest—whether that’s in improving monitoring, enhancing observability tooling, or increasing automation to offload repetitive responses.
GCP services for observability
Cloud Logging: Configuration, querying, and analysis
Cloud Logging serves as the centralized hub for capturing, storing, and analyzing logs generated by all your services running on GCP. It supports both structured and unstructured logs, which allows teams to enrich logs with key-value metadata for more effective filtering and querying.
Configuration starts with setting up log sinks that route logs to different destinations (Cloud Storage, BigQuery, Pub/Sub) for long-term retention, advanced analytics, or real-time event-driven workflows. Logs can be ingested from virtually any GCP service, Kubernetes clusters, or even on-premise workloads.
Once logs are collected, the Logs Explorer provides a powerful querying interface using Log Query Language (LQL), a log-querying syntax similar to SQL, to filter logs by severity, labels, resource types, or text content. This makes it easier to isolate relevant log entries during incident investigations.
Beyond simple queries, Cloud Logging integrates tightly with alert pipelines. You can create log-based metrics, like custom counters or distributions derived from log patterns, that feed directly into Cloud Monitoring. For instance, a surge in “error” or “timeout” log entries can trigger alerts, prompting proactive intervention before customers are impacted.
Cloud Logging serves as a foundation for real-time operational awareness, security audits, debugging, and automated responses.
Cloud Monitoring: Setting up dashboards, alerts, and metrics
Cloud Monitoring provides the nerve center for metrics-based visibility in GCP. It enables teams to collect, visualize, and alert on performance indicators from services running across GCP, on-prem, or other clouds.
Setting up dashboards in Cloud Monitoring is a visual experience that lets teams create customized views into system health. You can combine charts from multiple services, track key performance indicators (KPIs), and share dashboards across teams. Dashboards are crucial not only for operational awareness but also for post-incident reviews and capacity planning.
Alerting in Cloud Monitoring revolves around alert policies that watch for metric thresholds, uptime checks, or sudden anomalies. These policies can be simple (detecting when CPU exceeds 90%) or complex, using multi-condition logic and rate-of-change evaluations. Alerts can trigger notifications to Slack, PagerDuty, email, or Pub/Sub, as well as automated workflows through Cloud Functions.
Cloud Monitoring’s metric collection supports both GCP-native metrics and custom application-level metrics. Teams can monitor infrastructure components such as Compute Engine or GKE alongside business-specific signals like the number of failed logins or transaction throughput.
Together, dashboards, metrics, and alerts form a comprehensive observability layer that empowers teams to detect, understand, and respond to issues in nearly real time.
Cloud Trace: Instrumenting applications and analyzing traces
Cloud Trace provides distributed tracing capabilities that allow teams to visualize and analyze how requests travel through their systems. It captures the detailed timing and flow of requests across microservices, APIs, and backend components, helping pinpoint latency bottlenecks, failed calls, or performance regressions.
Instrumenting applications for Cloud Trace starts with integrating client libraries or using OpenTelemetry to collect spans, the individual operations or steps within a trace. These spans are automatically correlated to comprise a full trace, showing the request journey end to end.
Once traces are collected in Cloud Trace, engineers can analyze the breakdown of execution times within each service call. This helps detect slow dependencies, queuing delays, or database contention. For example, if a request traverses five services, Cloud Trace can reveal that 60% of the latency occurs in one database query.
Cloud Trace also integrates with Cloud Monitoring, so you can connect traces with corresponding metrics and alerting. This means that when an alert fires due to increased latency, you can immediately jump to traces associated with affected requests to diagnose the root cause.
In a distributed system, Cloud Trace transforms opaque request flows into understandable paths, improving both debugging during incidents and performance optimization during normal operations.
Error Reporting: Identifying and managing errors
Cloud Error Reporting acts as a contextual enrichment engine for your logged events. While Cloud Logging allows you to capture every log line in raw form, Error Reporting prioritizes this data by detecting, extracting, and intelligently grouping errors that share the same root cause or stack trace.
This becomes particularly valuable when systems generate a flood of logs during incidents. Instead of parsing thousands of entries manually, Error Reporting aggregates repeated errors into single, actionable entities. It highlights the frequency, first occurrence, and last occurrence of each error type, providing engineering teams with a prioritized view.
And that’s not all—Error Reporting attaches stack traces and links to relevant log entries and tracks whether an error is a regression or a recurring issue. It serves as the narrative summary of what went wrong, transforming noisy logs into concise, meaningful insights.
Beyond the console, Error Reporting integrates with alerting systems, Slack, PagerDuty, and ticketing tools. It can also trigger automated workflows that help remediate errors, like rolling back deployments or notifying engineering owners, improving both response speed and reliability.
In essence, Error Reporting narrows the gap between raw data and operational insight, serving as an indispensable layer of semantic processing within the observability stack.
Cloud Error Reporting provides a powerful mechanism for surfacing, grouping, and prioritizing application errors in near real-time. It automatically aggregates errors from logs, extracts stack traces, and surfaces the most frequently occurring issues. This reduces noise and highlights patterns that demand immediate attention. Error Reporting integrates tightly with Cloud Logging, avoiding manual parsing when capturing log-based error patterns.
This tool is valuable for operational health, especially when paired with automated workflows that can notify teams, create tickets, or even initiate rollbacks based on error severity.
OpenTelemetry: The gateway to standardized observability
OpenTelemetry plays a pivotal role beyond just error tracking. It is a vendor-neutral, open-source framework that standardizes the collection of telemetry data across logs, metrics, and traces. Instead of managing brittle, peer-to-peer tool integrations, OpenTelemetry allows teams to collect consistent telemetry once and export it flexibly to any backend—including GCP, AWS, Azure, or third-party observability platforms.
This standardization simplifies observability architecture, reduces lock-in, and enhances portability for multi-cloud or hybrid deployments. By adopting OpenTelemetry, teams future-proof their observability strategy, streamline pipelines, and gain confidence in the consistency of their visibility stack as technologies evolve.
OpenTelemetry acts as the connective tissue that transforms disparate monitoring tools into a cohesive, reliable observability ecosystem.
Automation strategies for GCP observability
Automation is a natural extension of observability, transforming detection into action. With a well-instrumented system, the next logical step is automating responses to common failure modes, minimizing downtime, and reducing operational toil. In GCP, automation is deeply integrated with observability tools, allowing signals from Cloud Monitoring, Logging, Trace, and Error Reporting to seamlessly trigger corrective or investigative workflows.
Here’s how to automate observability tasks in GCP:
- Use Cloud Monitoring alerts to trigger Cloud Functions
You can configure Cloud Monitoring to watch for threshold breaches or anomalies and respond by invoking Cloud Functions. With this automation, you’ll get immediate, programmable reactions to incidents, such as restarting a service, logging diagnostic context, or triggering downstream actions—without waiting for human intervention. - Orchestrate recovery workflows with Workflows
When the response process involves multiple dependent steps, like validating the alert, rolling back a deployment, and notifying the team, GCP Workflows offers a structured way to define and chain these actions. This makes complex automation easier to manage and ensures critical paths are handled reliably. - Enrich alerting via structured logs and custom labels
Structured logs provide machine-readable metadata that enhances the context around errors or anomalies. Adding custom labels (e.g. service=checkout, severity=critical) allows alerting systems to filter and route messages more effectively, which promotes faster diagnostics and better team coordination. - Capture exceptions with error reporting for automatic grouping and visibility
Cloud Error Reporting aggregates exceptions from multiple sources, automatically grouping similar errors and surfacing the most frequent ones. This reduces noise and highlights systemic issues early. Combined with OpenTelemetry or Cloud Logging, it creates a seamless pipeline from application failure to actionable insights.
These automation strategies create a feedback loop where systems detect issues and act on them swiftly. GCP provides a flexible set of building blocks that connect observability with operational workflows, enabling resilient and self-healing infrastructure.
Using Cloud Functions and Workflows for automated responses
Cloud Functions act as lightweight, serverless execution environments that respond to observability signals in real time. Whether it’s a spike in latency, error rates, or resource exhaustion, a Cloud Function can immediately execute remediation logic to restart services, scale instances, or log diagnostic snapshots.
Workflows orchestrate multistep processes that require sequencing and conditional logic. A workflow might validate the severity of an alert, check recent deployment history, notify specific teams, and execute a rollback—all in a controlled and auditable fashion.
When used together, functions and workflows create an intelligent automation fabric where simple tasks are handled immediately and complex processes are executed reliably, all driven by observability signals.
As we mentioned, Cloud Logging, Monitoring, and Trace are core to collecting signals. Error Reporting adds the ability to capture, group, and surface exceptions in near real-time. Likewise, to move from insight to action, Cloud Functions enable event-driven responses, and workflows help orchestrate more complex recovery sequences. Together, they form a cohesive stack for responding to incidents with speed and context.
In one instance, Cloud Monitoring might detect a spike in CPU and trigger a Cloud Function to scale up. Cloud Logging could spot security anomalies and trigger isolation protocols. Workflows enable chaining these actions for more complex incident playbooks.
Creating custom alerting strategies
Effective alerting is about delivering the right signal, at the right time, to the right audience. This begins with crafting alerts that are both meaningful and actionable.
OpenTelemetry standardizes telemetry data formats. It eliminates the need for brittle, bespoke integrations between services, instead offering a portable, consistent structure for logs, metrics, and traces.
With OpenTelemetry feeding into GCP's observability stack, teams can create sophisticated alert policies that incorporate not only metrics but also log-based patterns and trace anomalies. Alerts can be dynamically enriched with context like affected services, deployment versions, or recent configuration changes.
This provides diagnostic context for engineers, a key point when incidents surface. Automated routing through Slack, PagerDuty, or ServiceNow further ensures the right responders are engaged without delay.
OpenTelemetry helps reduce fragmentation by standardizing how telemetry data (metrics, logs, traces) is collected and formatted across services. In GCP, it integrates directly with Cloud Monitoring and Cloud Trace and can also be configured to export structured logs compatible with Cloud Logging.
With this system, developers can implement applications in a vendor-neutral way, ensuring that telemetry remains portable and consistent even in polyglot or multi-cloud environments.
In tandem, custom alert strategies ensure the right people get notified with the correct context, regardless of where the signal originates.
Practical examples and use cases
Practical application is where the theory of observability and automation truly proves its value. Let’s walk through a real-world example that demonstrates how detection, diagnosis, and resolution come together in a cohesive, automated workflow.
Consider this scenario: a microservice running on GKE starts failing due to a recent misconfiguration. Cloud Monitoring detects an error rate spike (MTTD) and triggers two immediate actions—sending a Slack alert to notify the team (MTTA) and invoking a Cloud Function to attempt an automatic pod restart. When the pod fails to recover, a workflow escalates the incident to PagerDuty (MTTR), engaging the on-call engineer with all relevant context already prepared.
Now, let’s imagine this scenario: a user initiates a routine request. Behind the scenes, a GKE pod answers it but crashes under load. Cloud Monitoring quickly identifies rising error rates and latency, closing the MTTD window. Simultaneously, Slack notifies the SRE team, and a Cloud Function launches to restart the failing pod automatically, minimizing potential downtime.
When the function runs but the issue persists, it signals that the problem is deeper than a transient fault. This marks the closing of the MTTA window, as human intervention becomes necessary. At this stage, Cloud Logging and Cloud Trace step in, capturing full-stack diagnostics—error logs, latency distributions, failed dependencies, and contextual metadata that point toward the root cause. A workflow takes over, escalating the unresolved incident to PagerDuty, officially transitioning into the MTTR window.
The on-call engineer receives more than just an alert—they are handed a full diagnostic bundle: the logs that led to the crash, trace data pinpointing service latencies, and a summary of error patterns from Error Reporting. Instead of starting from scratch, the engineer enters the situation with clarity, armed with the exact data needed to move directly toward resolution—shortening the MTTR window dramatically.
Best practices for GCP observability
Establishing effective observability involves developing a strategy that balances insight, automation, and maintainability. These best practices help teams avoid common pitfalls while scaling their observability maturity.
Basic advice for GCP observability
- Start small with reliable automation (like pod restarts). Begin by automating simple, deterministic actions that reduce manual toil before advancing to full remediation.
- Avoid alerting on everything. Poorly tuned alerts generate noise that desensitizes teams and leads to missed signals.
- Validate all alerts in pre-production. Check that every alert fires for the right reason and with the right context. This practice minimizes false positives and increases operational trust.
Tips to avoid overengineering
- Use OpenTelemetry for standardized instrumentation. This reduces complexity and ensures telemetry remains portable across environments.
- Prefer native integrations wherever possible. Stitched-together custom solutions often become brittle, expensive to maintain, and challenging to troubleshoot.
- Avoid temporary pipelines that solve short-term issues but create long-term technical debt. Prioritize building solutions that scale with your system’s complexity.
Crawl-walk-run guidance
- Crawl: Focus on centralizing observability signals (logs, metrics, traces) and establishing baseline alerts for critical components. The goal is to gain visibility before taking action.
- Walk: Introduce automation for repetitive operational tasks, particularly triage steps such as restarting pods or isolating impacted services.
- Run: Advance to orchestrating full remediation workflows, including dynamic scaling, rollback processes, or multistep recovery procedures driven by observability signals.
Conclusion
Observability in GCP transcends simple visibility. It enables systems to not only detect problems but also to trigger meaningful, automated responses that accelerate recovery and reduce operational burden. When integrated with automation, observability forms a feedback-driven system that continuously improves response time and operational reliability. Observability shifts the response model from manual investigation to proactive, programmatic actions—whether restarting failed services, executing rollbacks, scaling resources, or routing alerts to the right team members. This reduces escalation risk and minimizes downtime.
This synergy fosters operational confidence, allowing teams to move beyond reactive incident handling toward resilient, self-healing infrastructure. Rather than being trapped in constant incident triage, engineers collaborate with antifragile systems designed to anticipate, diagnose, and resolve issues in real time. Rich telemetry combined with event-driven automation empowers timely interventions, targeted diagnostics, and efficient recovery workflows.
The power of observability lies in its ability to close the loop from detection to resolution. With speed, clarity, and confidence, turn noise into insight and insight into action.